blocks.so
Free app blocks built on shadcn/ui
LibraryFree
Categories
Animated charts in the style of shadcn/ui
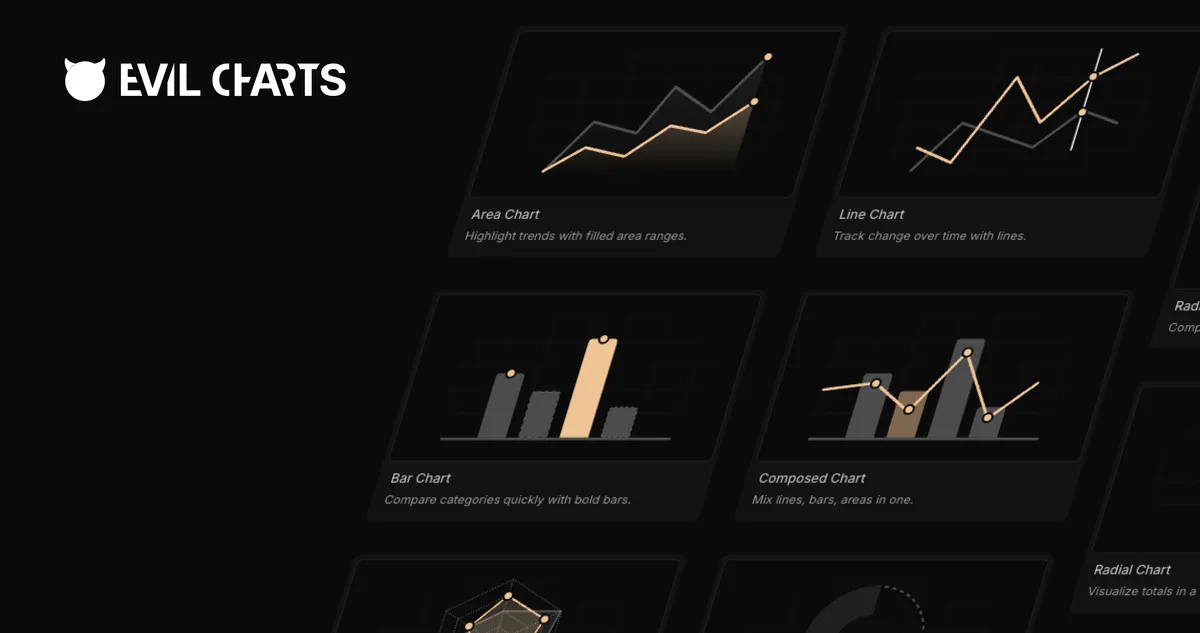
Evil Charts provides animated, interactive charts for React that match the look of shadcn/ui. Each chart, such as area, bar, line or pie, comes either on Recharts with SVG or on Apache ECharts with canvas, and it is installed through the shadcn CLI as your own code. Gradients, patterns, glow effects, reveal animations and animated loading states are already set up.
npx shadcn@latest add @evilcharts/recharts-area-chart